

The Power of Infographics: Six Tips to Leverage Visuals for Maximum Impact in Your AEC Marketing Strategy Tactics
The AEC (Architecture, Engineering, and Construction) industry has been using infographics increasingly over the past five to ten years to illustrate the planning, design, and construction of projects, processes, people, and complex content.
Infographics have proven to be highly useful because they enable AEC marketers to communicate ideas quickly and effectively. In addition, visuals can help highlight key points and important data in a way that is easily identifiable. This approach can be especially useful in technical fields like ours when selection committees are reviewing multiple submissions and you want them to remember your most important data.
Why are infographics so effective in AEC marketing content?
- High quality infographics are 30 times more likely to be read than text articles.
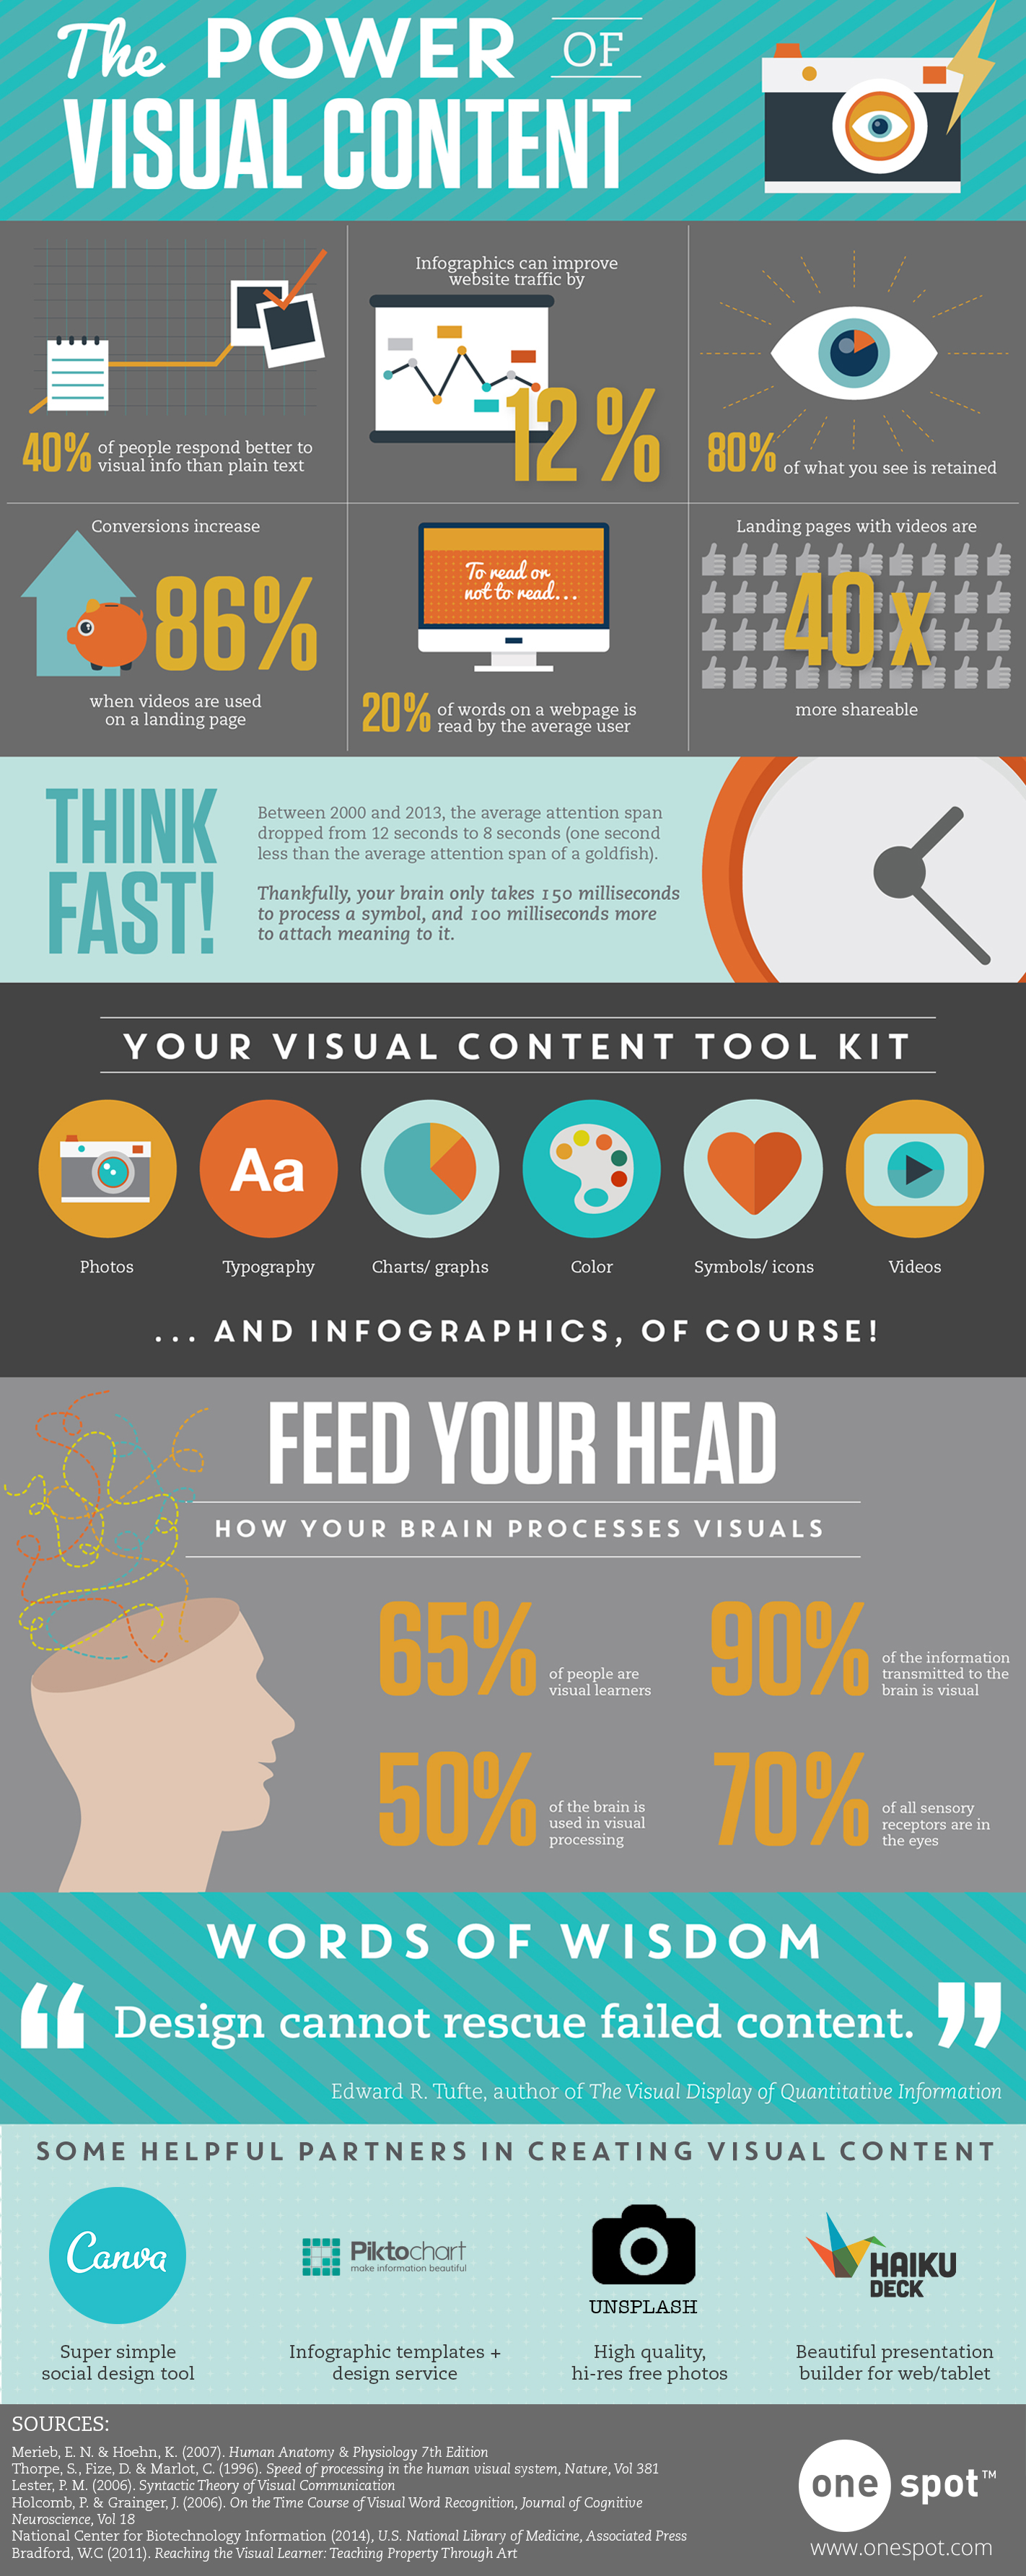
- We process visuals 60,000x faster than text,
- Publishers that feature infographics grow traffic 12% faster than publishers that don’t,
- 65% of the population are visual learners,
- The words “infographic” and “infographics” are searched an average of 547,000 times per month in Google.
- 90% of information transmitted to the brain is visual.
- Social media posts with images receive 150% more shares.
- Sites that use infographics generate 12% more traffic on average. (Ansonlex)
- 32% of marketers believe that visuals are the most important type of content that they're business creates. (Social Media Examiner)
- In 2019, 74% of marketing content contained a visual element. (Venngage)
- 65% of brands use infographics for marketing purposes. (Xerox)
- 56% of marketers use visuals in all of their marketing content. (Social Media Today)
- Infographics can increase website traffic by up to 12%. (One Spot)
- Infographics are the fourth most-used type of content marketing. (HubSpot)
- In 2018, 69% of marketers said that visual content was either "very important" or "absolutely necessary." (Venngage)
We have become a generation of consumers that need the important points fast. AEC content consumers are no different. Infographics can simplify the highly technical data needed for proposals and other content using well-designed graphics to represent and explain the data in a fast and easily understandable way. This technical data can now become inviting, interesting, and easier to comprehend. Infographics can be used in all aspects of your AEC marketing, including proposal, presentations, technical reports, printed materials, online marketing, and social media marketing. They can also help enhance your client presentations, and can even be translated to video.
Six Tips to Follow to Create Better AEC Infographics
Creating AEC infographics is a process. There are many software tools you can use to successfully make visuals with or without graphic design skills. Follow these tips for creating clear, concise, and creative graphics.
1. Content first. Graphics last.
Just as we suggest in proposal management, you must create the strategic content first before worrying about the visuals. Start with a list of key points or an outline. Determine if there are visuals your AEC technical professional already has in mind to illustrate the concept. If not, make a list of concepts that need to. Once you have the rough outline, then add any references or research you want to include to support your claims. When the outline process is complete, it is much easier to sketch out how information will be visually communicated and how you want your text and graphics to be arranged. Decide on a hierarchy to show which content is more important than others, and which content is supporting detail or reference. The information should flow seamlessly. It should be obvious to the reader where their eyes should go, and the order of what they should be reading.
2. Tell a story, quickly
Your infographic needs to grab a readers’ attention at a glance. How can you tell your story quickly? How can you grab their attention and make them want to read the corresponding information? What makes your topic important to them? Answer these questions and your infographic will be effective.
3. Know your audience
To create an effective infographic, you must first understand your target audience. In the case of AEC content, your audience is likely to vary from project to project. Boilerplate infographics are not your best bet. Work with your technical staff to make sure the infographic is designed to the level of your audience. Your infographic should be informative, visually appealing, and provide relevant data in a clear and concise manner.
4. Design high quality visuals
Visuals are the heart of any infographic, so it's important to use high-quality graphics and images. Avoid using low-resolution images or graphics that are too small to read. Use color and typography effectively to create a visually appealing design that draws attention to key points. Keep colors and typography simple, yet impactful. Your branding guidelines or even the branding guidelines of your target audience are a good place to start. Avoid white backgrounds and don’t include too much text. Adobe has a great tool to help you create the perfect color palette.
5. Focus on a single message
Infographics are most effective when they focus on a single message or idea. Avoid cramming too much information into a single graphic, as this can be overwhelming for your audience. Identify a key message you want to convey and structure your graphic around it.
6. Make it shareable and SEO friendly
Infographics are great for AEC social media marketing because they are highly shareable. Since infographics are typically viewed on a screen, make sure your visuals are optimized for social media by creating different sizes for different platforms, adding social media sharing buttons, and including a call-to-action that encourages viewers to share it with their followers. Don’t forget to use them for e-newsletters, industry newsletters/magazines, association content and websites. Outside sources are always looking for content. Notify a network of websites and blogs about the infographic to get more views and shares.
Infographics are a creative way to convey information quickly and clearly, boost brand awareness, and reach out to target audiences. Find ways to incorporate this powerful tool to clarify proposal content, highlight differentiators, increase engagement, inform your readership, and convert website visitors into clients.


